
The Makeover Monday for week 5 2019 is about The Digital Economy and Society Index (DESI).
DESI is a composite index that summarises relevant indicators on Europe’s digital performance and tracks the evolution of EU member states in digital competitiveness.
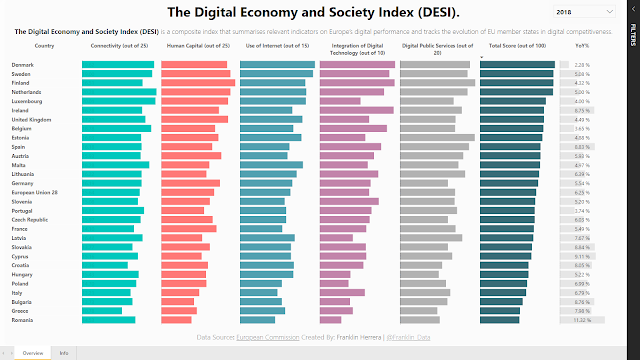
Original Visualization:

What works well?
- Ordering countries by the total DESI Score.
- Using different colors for each category.
What could be improved?
- Using a horizontal bar chart instead of a vertical.
- Changing the country code by country name.
What I did?
I wanted to see the data in a horizontal bar chart, but, It wasn't really looked good. So, I decided to create 5 horizontal bar chart for each category to improve the visualization, but it didn't work, each country name was different in each category. For example, Netherlands was the number one in Connectivity, but, Finland was the first in Human Capital, so, it would be confusing showing different country names for each category in a horizontal way.Therefore, I created a personalize matrix chart (or table) doing this:
- Created 5 meausres for each category to use each of them as a values:.
- Added conditional formating using data bars.
- Applied the same colors to the values of each column in the field formatting option and align them to the left.
- Add a YoY% measure.
- Removed the vertical and horizontal grids.
- Used a row padding of 2 pixels.
- Add a Year slicer.
- Resized the columns of the table and sorted by Total Score.
- Used a proper Text Size.


No comments:
Post a Comment