
Data for a Cause challenge!
This visualization is because #dataforacause, and if you do not know what #dataforacause is, let me tell you that it is a nice way to help not-for-profit organizations through visualizations or storytelling. The organizer of this is @OlgaTsubiks and in her blog you can find more information about #dataforacause, how it works, who do we work with, what gets created, who is already here and how to join it.
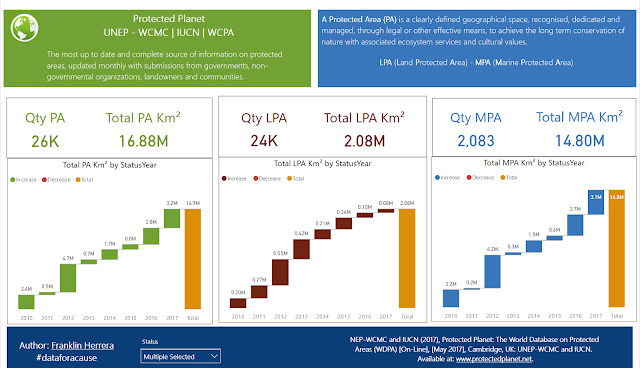
In this ocasion, I made a visualization using Power BI to United Nations Environment Programme (UNEP) and the goal of this is to compare land and marine protected areas to show the positive growth since 2010. The dataset used is from Protected Planet on national parks, conservation areas, marine reserves, etc. This dataset it is better know as the World Database on Protected Areas or WDPA for short.
WDPA is the only global databae of protected areas and how its manual says it is a joint effort between IUC and UNEP, managed by UNEP-WCMC, to compile protected area information for all countries in the world from governments and other authoritative organizations which are referred to as data providers.
This source it is aveilable at: UNEP-WCMC and IUCN (2017), Protected Planet: The World Database on Protected Areas (WDPA) [On-Line], [May 2017], Cambridge, UK: UNEP-WCMC and IUCN. Available at: www.protectedplanet.net.
If you want to ask or comment something do not dude to do it. I hope you can enjoy this visualization and learn something about protected areas like I did.


Hey! Franklin, the viz is really great!
ReplyDeleteI am novice in the area of visualization, and I want to study your Visualization.
How did you make it? which tool? If you made it using tableau,is it possible to share the workbook.(email-pavanpateltp@gmail.com)_
Thanks for the help!
Hello! Thank you, I am glad that you like the viz.
DeleteHow I did it? I had study some courses and specializations in business intelligence and data visualization and now I can make visualization like that.
Which tool? Power BI Desktop.
Best regards.